
Loggersmap – web application
- Real time temperature and humidity data with history online from anywhere in the world.
- Place your sensors on Google Map or on integrated images of your choice integrated into the map
- Create and manage sensors groups, manage user groups and users.
- Programm sensor limits and logging interval.
- Alarms per E-mail sent to on or to many users.
- User right managment.
- All your data will be securelly saved in a data center in Switzerland.
- We can also integrate your existing data loggers or use Cloud Data Logging data logger.
Main functionalities
Map view with sensors auto grouping. This function optimize the map/image navigation, visualisation not only for PC, MAC, but also for mobile and touch screen devices. (PC/MAC/tablet, i-Pad…). Groups are represented by squares. If a group turns red, then it contains at least one sensor in alarm state.

With one click, the sensor value is displayed and a graph can be generated or data can be exported, other actions are also possible like configuration (for administrator only) and more. The starting view can be defined for each user. This starting view can be a map, an image, a plan or a scheme.
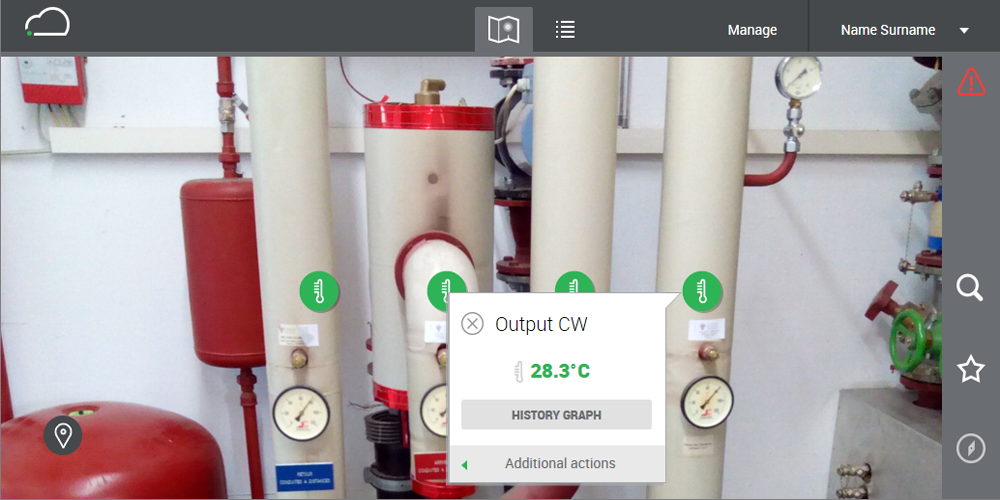
Visual localization of alarms with direct link to the sensor.

Optimized internet navigation with favorite and sensor search..

Look at instant values on your own integrated plan with tendencies and direct link to alarm detail and history graph.
In this particular case, the sensor state is still red, even values are in a normal state because a previous alarm has not been validated. This alarm validation is an option you can set for each sensor. This requires a user to validate the alarm.
The red square indicated another group of sensors with an alarm in another embedded image.

Contact us for a demo
Look at your alarms in a form of a list with filter and sort possibilities, alarm validation history with comments and user action . Alarm validation can be defined for each sensor with or without comment as mandatory or not.

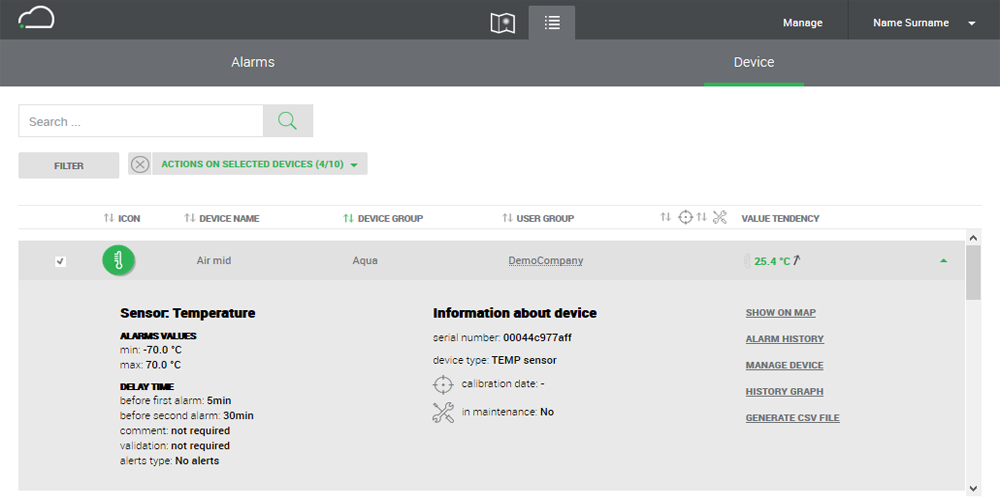
Lists of sensors with their state, values and tendency, filter and sort possibilities with filter for maintenance management based on date.

Action on chosen sensors with data export and graph generation.

Graph generation with periode specification for one or multiple sensors with print possibility.

Contact-us for a demo
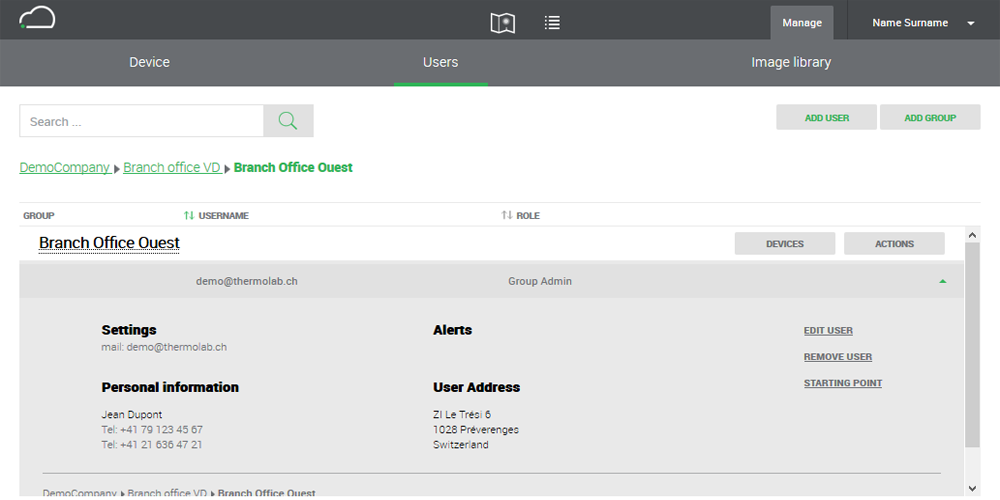
Only administrators have access to management functions. Users, users groups, sensors, sensors groups, images and rights.
Administrators can administer, add, remove sensors, configure limits logging intervals, schedule maintenance make alarm validation mandatory or not, make comments mandatory or not. Any comments and alarm validation will be user and time stamped.
Administrators are able to create users and to give them rights, or create user groups, to determine for each users or groups their starting view. Each user can determine his own user language. (french, english, german)
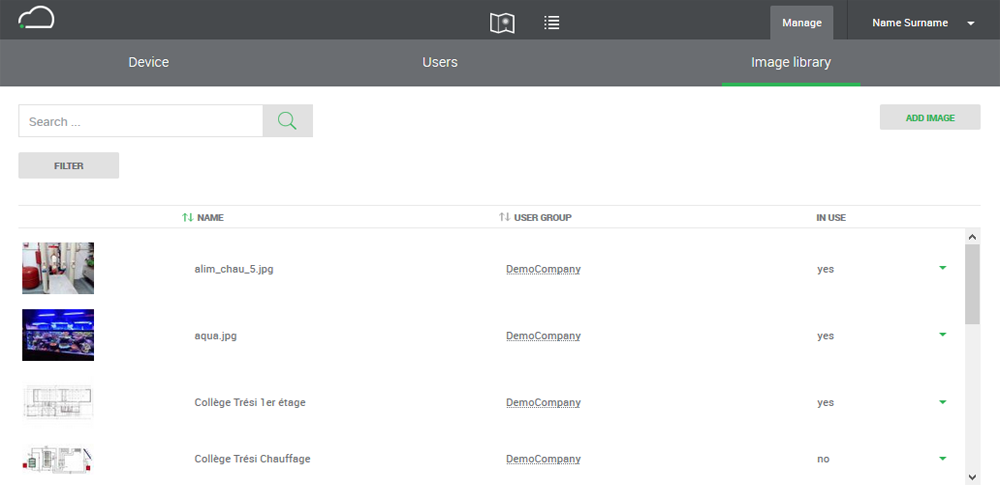
Picture management is also accessible to administrators, they can add their own pictures necessary to their environment. Administrator will then be able to put sensors at the apropriate place.
Contact-us for a demo
Application and interface developped by NetConcept SA